Bitcoin cleared $65,000 and Ethereum rose nearly 6% this week on softer inflation data. Thursday’s pullback is orderly: most of the top 50 coins are down less than 3%, with Ondo being the only outlier at +14%.
XRP is trading at $1.10, down 0.54%, with an overall indicator score of -42% and a confirmed deathcross on the daily chart.
XRP’s biggest near-term catalyst – a Senate vote on the Clarity Act – has slipped past July 4 and now appears unlikely to land until late July or August at the earliest.
Markets are breathing on Thursday after one of the cleaner, macro-driven crypto pumps of 2026. The June consumer price index fell 0.4% – the steepest one-month drop since April 2020 – sending the odds of a Fed rate hike for July crashing from 31% to single digits, sending stocks higher and giving crypto a reason to run.
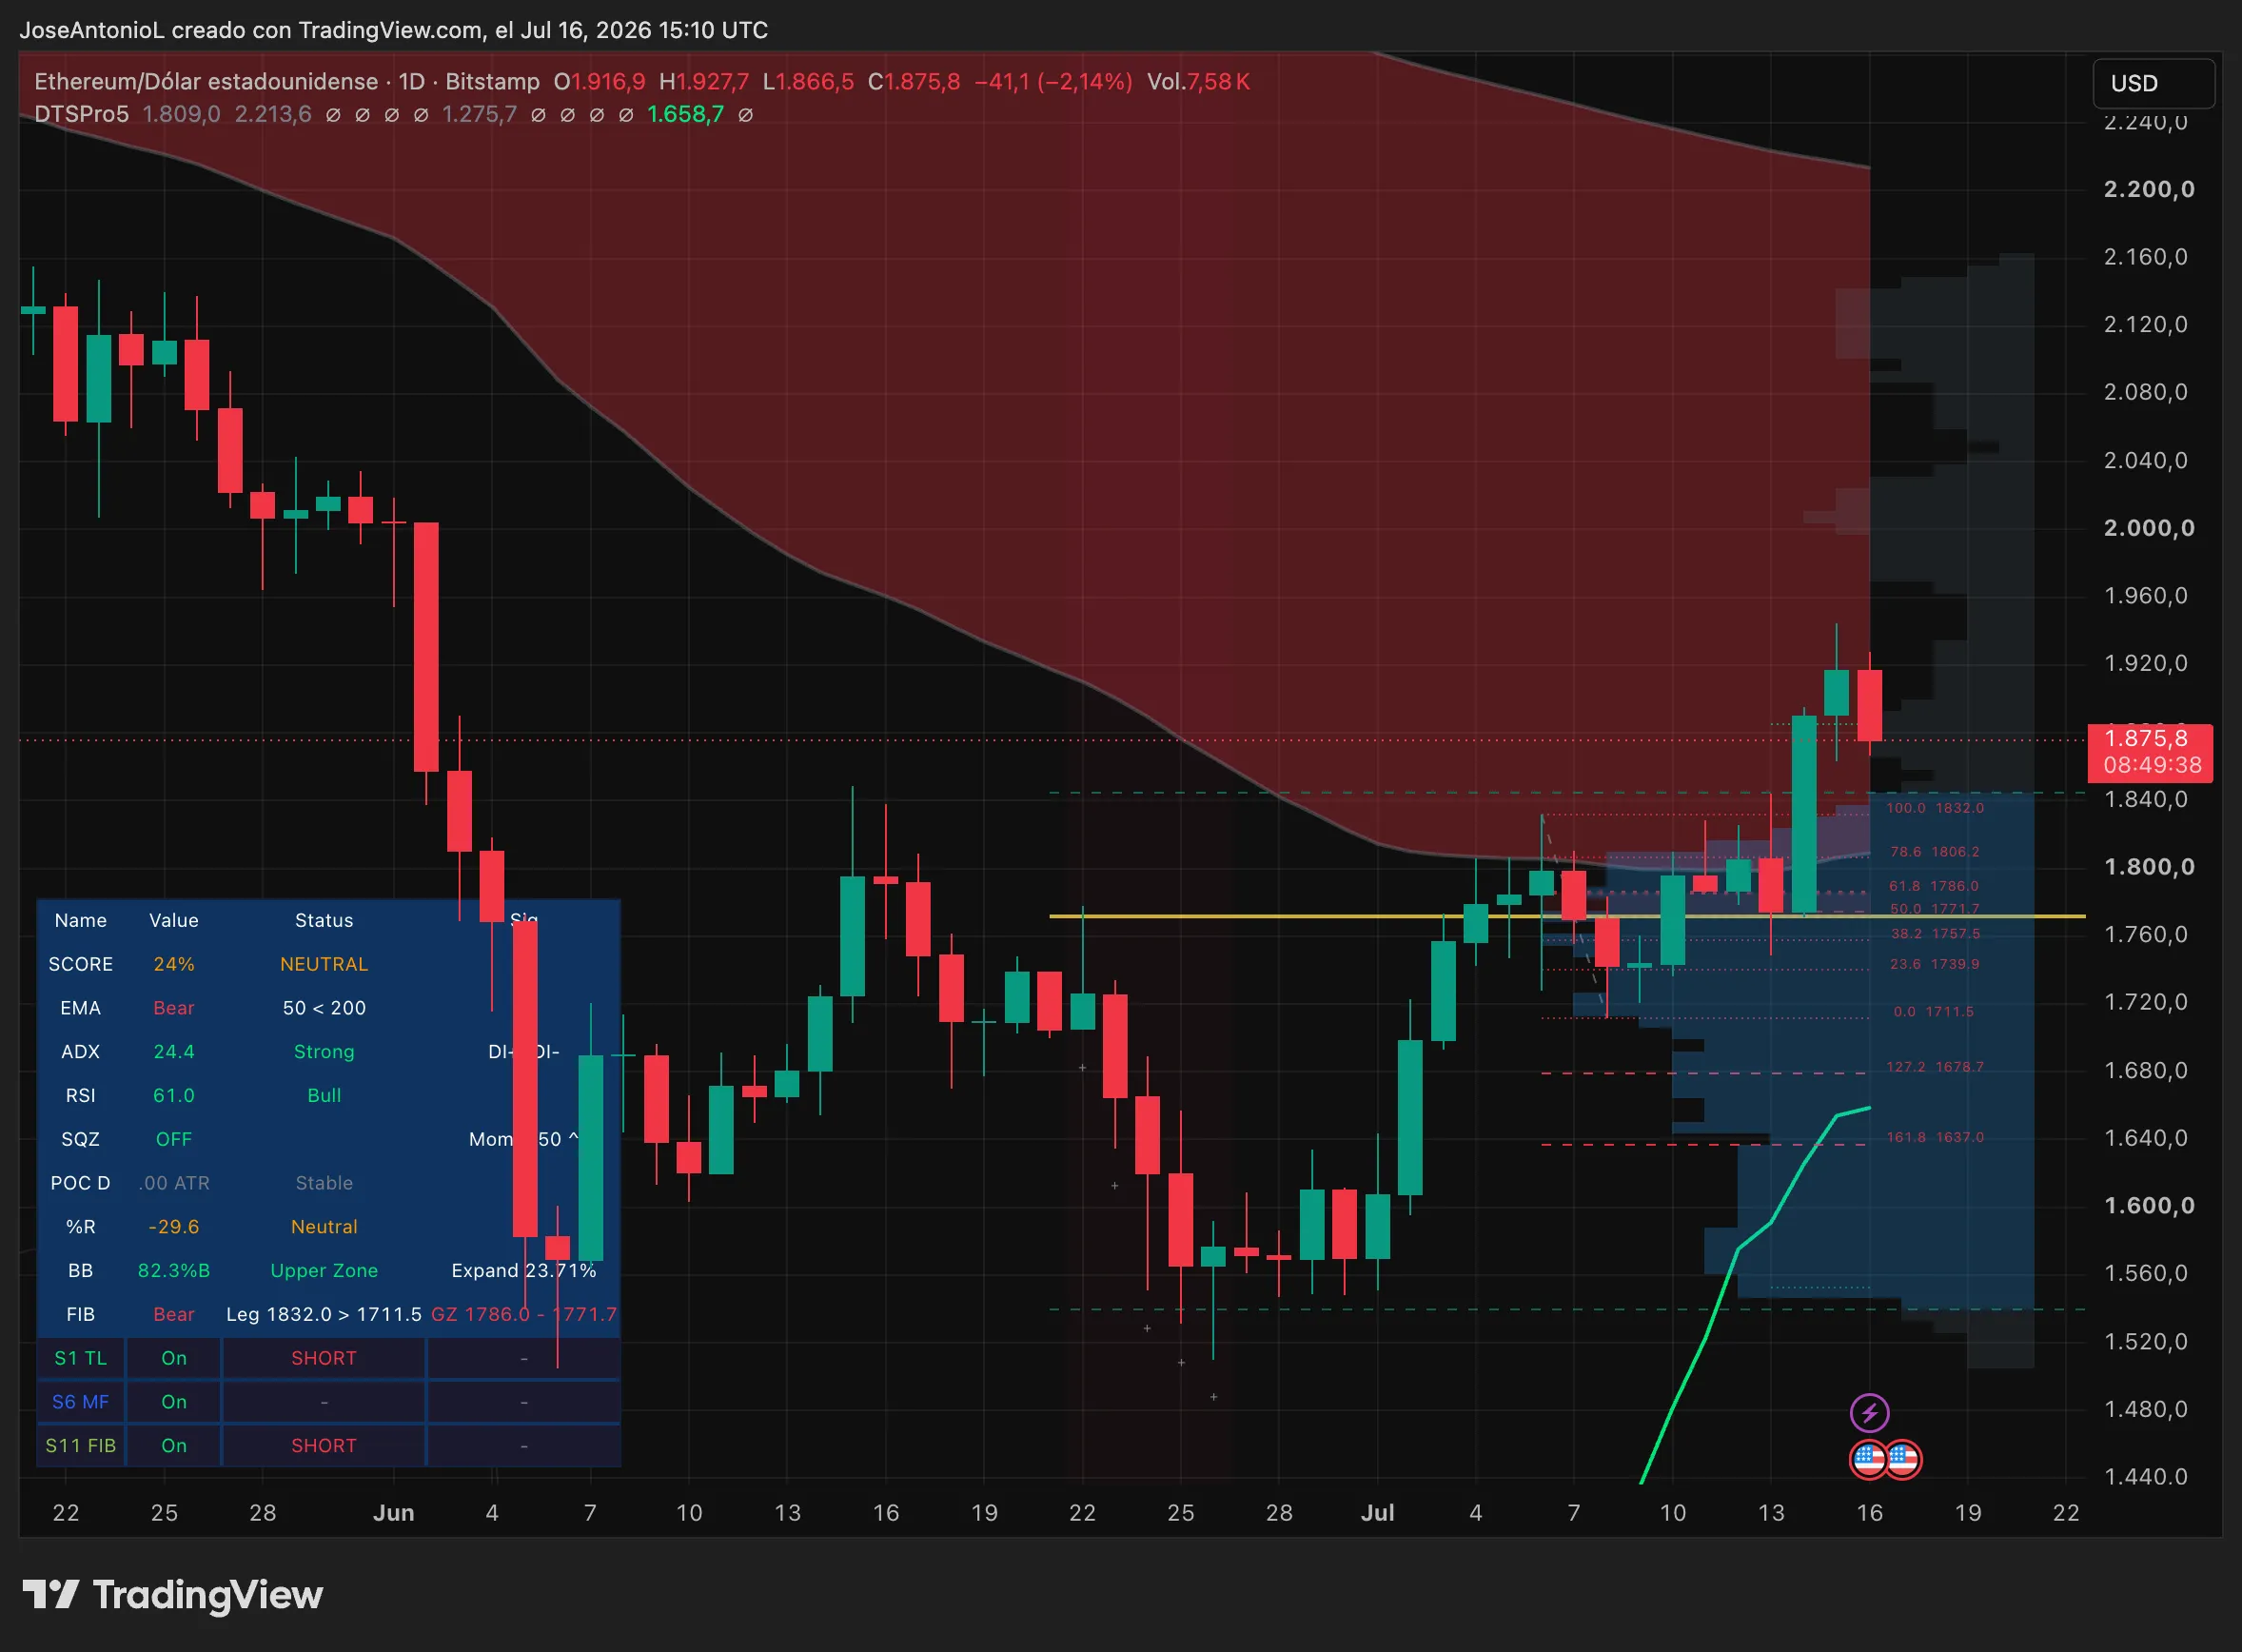
Wall Street also delivered, with Goldman Sachs, JPMorgan, Morgan Stanley and Citi all posting second-quarter profits that beat expectations. If Decluttering covered TuesdayBitcoin has broken through the $64,000 resistance that had capped it for weeks. Ethereum went even further: almost 6% in one day, to $1,900.
Today’s dip, with most top 50 coins down less than 3%, is a consolidation. Ondo is the only exception, up over 14% and leading the entire top 100 by market capitalization and tokenization momentum.
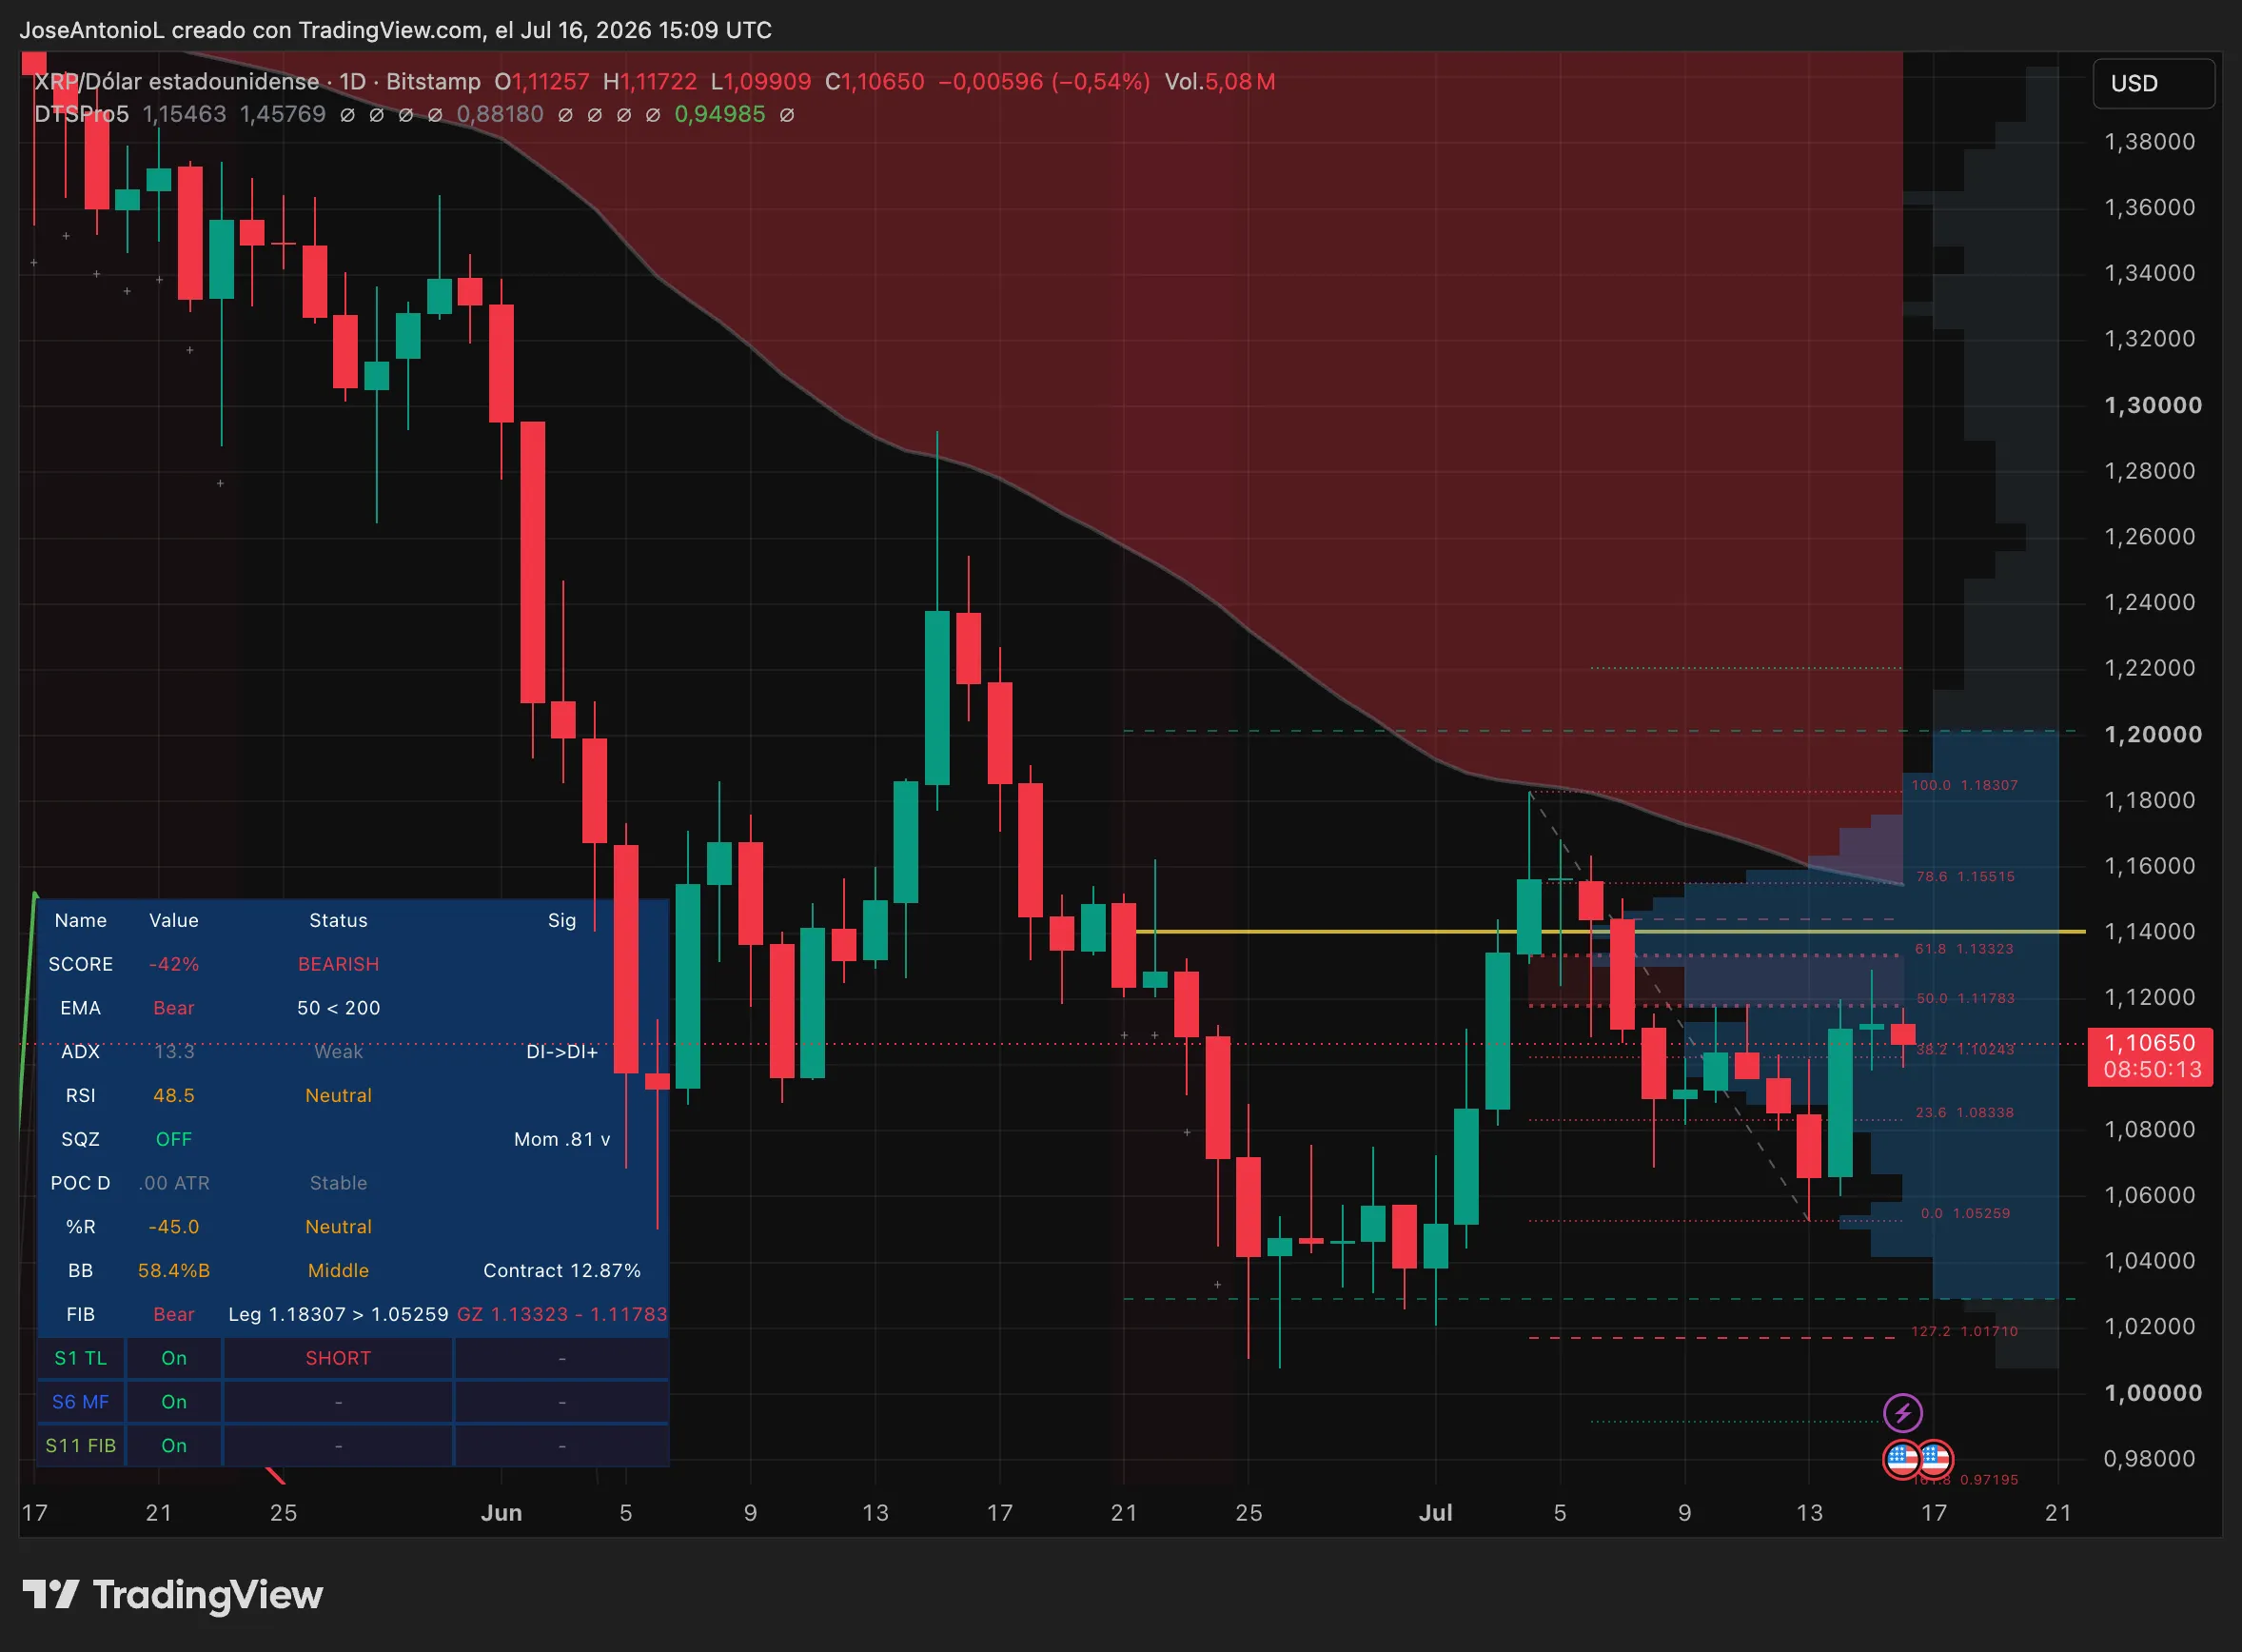
But not everyone is breathing hopium: XRP’s version of the rally was disappointing. The coin created by Ripple’s co-founders opened at $1.11257 on Thursday, reached a high of $1.11722 and is now at $1.10650 – down 0.54%. It didn’t crash. But it didn’t work either, not during the good days and not even now that the comparison is being flattered by a market that is already in retreat.
Overall, XRP failed to break the Crypto Winter price resistance (the dotted line) when it was time. With markets slowing, the XRP army doesn’t look as bullish as other altcoins.
XRP price data. Image: Trading view
Why? When money gently returns to crypto after a period of risk-off, it does not spread evenly. Bitcoin absorbs it first. Ethereum goes next – and ETH has historically led the broader cryptocurrency recovery, which is exactly what happened this week.
Overall, Ethereum looks more bullish than Bitcoin in the short term. The crash was more painful, which explains why the recovery may have stronger momentum.
XRP price data. Image: Trading view
The Altcoin Season Index at 45 (below 50 indicates BTC/ETH dominance) confirms that capital has not yet rotated along the risk curve into altcoins. That dynamic was also visible in early July: when a short liquidation of $602 million sent Bitcoin back to $62,000, XRP managed to gain just 3%, while Ethereum and Solana nearly doubled that move.
The other missing piece is that of XRP. The Clarity Act – US legislation that could classify XRP as a commodity and boost institutional ETF demand – missed its expected Senate vote on July 4. With no date on the calendar, XRP trades solely on macro sentiment – and is losing that battle to Ethereum.
XRP Price: Running out of Fibonacci space
XRP opened today’s candlestick at $1.11 and is currently trading at $1.10, with a market cap of about $69 billion, for a small dip of half a percent. Ripple’s token is currently testing a weak support zone from its most recent bearish leg: a move that ranged from $1.18 to $1.05.
That puts the price at a decision point: hold here and go for $1.13, or lose the $1.08 level and reopen the path towards $1.06 and the critical bottom of $1.02.
XRP price data. Image: Trading view
The ADX (Average Directional Index) stands at 13.3, well below the threshold of 25 that confirms that there is a real trend. ADX measures trend strength on a scale of 0–100, direction-agnostic. Think of a car running in neutral: the engine spins but doesn’t go anywhere. Below 20 is the range traders associate with choppy, directionless markets where false breakouts are common. There is one slightly hopeful conclusion: the direction indicator shifts from DI- (bearish dominance) to DI+ (bullish dominance). However, with ADX 13.3, ‘switching’ means a lot of work.
The Exponential Moving Averages (or EMAs, which give traders insight into price movements over time) tell the clearest story. The average price of the past 50 days is trading well below the average price of the past 200 days in a formation called the Death Cross.
A death cross is the most widely recognized bearish trend signal in crypto, and XRP has been stuck in it since falling from its all-time high of $3.65 in July 2025. As Decrypt reported on Tuesday, Bitcoin is currently battling its own death cross. For XRP, there is no sign yet that the two averages are starting to converge.
The RSI (Relative Strength Index), a momentum meter from 0-100 where above 70 is overbought and below 30 is oversold, is at 48.5. Right in the middle, no pressure in either direction. The Squeeze Momentum indicator is ‘off’ with a momentum reading of 0.81v: slightly positive but weak – enough to say the energy is building, not enough to say where it is going. Looking at the charts, it appears that XRP may soon show signals of price compression. Whether it falls apart or breaks will likely depend on Bitcoin holding $64,000 and news from the Senate about the Clarity Act scheme.