



Bitcoin (BTC) briefly broke past the $81,000 mark on August 25, but immediately ran into heavy technical resistance, causing the price to hover indecisively around $80K. Several factors now make this level significant, especially for those seeking an additional buy opportunity before the coin surges to $100,000.
Bitcoin and the $80K inflection point
Once again, Bitcoin’s chart continues to track that of the 2022 market bottom. Towards that cycle’s end, Bitcoin broke off its downtrend, tested a previous August high, then pulled back to $20,000 before formally beginning its bullish momentum.
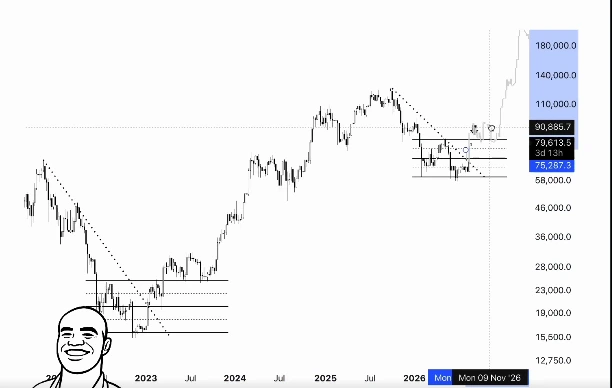
Source: Ali Charts
Applying this fractal places the May 2026 high of around $83,000 as the next resistance ceiling, with a downward retracement presenting a prime accumulation opportunity ahead of the next leg higher. Breaking past this level would be no mean feat, with several indicators showing why it is a strong resistance zone.

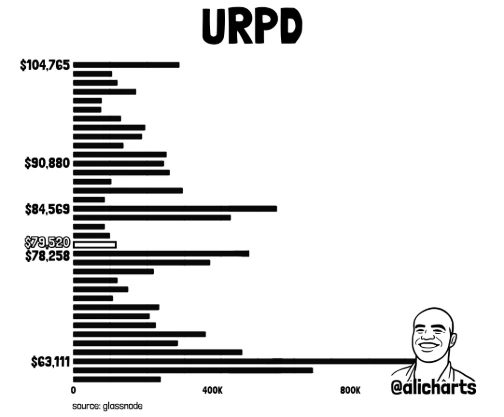
The first is the UTXO Realized Price Distribution (URPD), which shows that nearly 975,000 BTC were acquired between $83,307 and $84,569. This flags the region as a supply hurdle to clear before the next major upside tick.
The second is on-chain trader profit margins, which are now at 25%. In the past year, such a reading often triggered rising sell pressure due to increased profit-taking, causing short-term price corrections. Whales appear to have already acted on this, recently achieving roughly $88 million in realized profits.
What next?
Should sell pressure persist, the next major resistance lies between $76,996 and $78,258, and thereafter $63,111, as seen on the URPD chart.
While grim, such events would offer the next optimal buy opportunity. However, closing above $80K consecutively on the daily and weekly charts would be a strong confirmation for bullish divergence.
Fundamental analysis
Spot Bitcoin ETFs recorded about $2 billion in inflows in the previous week, making it the strongest single-week performance in 10 months.
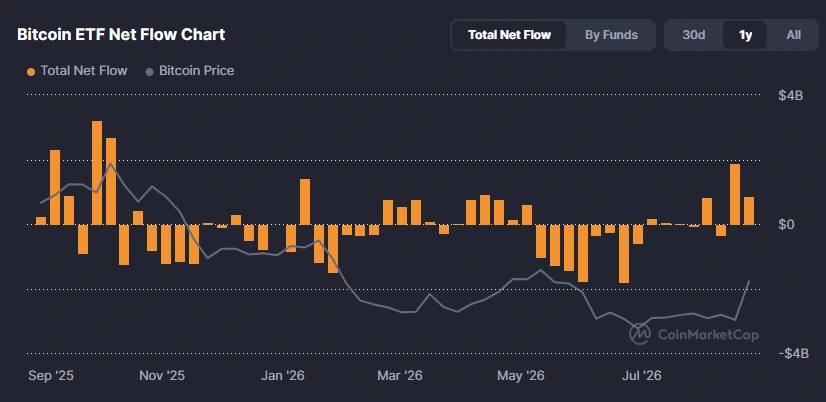
Source: CoinMarketCap
This contributed to the recent positive price action, with more of it expected to come with the September CLARITY Act vote.
Was this writing helpful?
Story Ends Here
Read the Next News