



Sui price is showing early signs of a potential trend reversal after spending much of 2026 inside a broad descending structure. The token has bounced from the lower boundary of the formation and is now trading near $0.82, putting bulls back in focus as they attempt to reclaim the key resistance at the $1.10 zone.
The weekly chart shows a narrowing price structure, with SUI repeatedly making lower highs while finding support near the lower trendline. A sustained move above the descending resistance could strengthen the bullish case and open the door toward $1.10 and higher. However, with SUI still below the major resistance zone, the latest rebound needs confirmation before it can be considered a decisive breakout.
SUI Price Analysis: Falling Wedge Puts $1.10 Back in Focus
The recent rebound in the SUI price rally has brought buyers back into the picture. It has moved above the $0.8 range, while the weekly RSI has recovered towards the mid-range after spending an extended period below the neutral mark. This suggests that selling pressure has eased, although the indicator has yet to signal a clear shift toward bullish momentum.
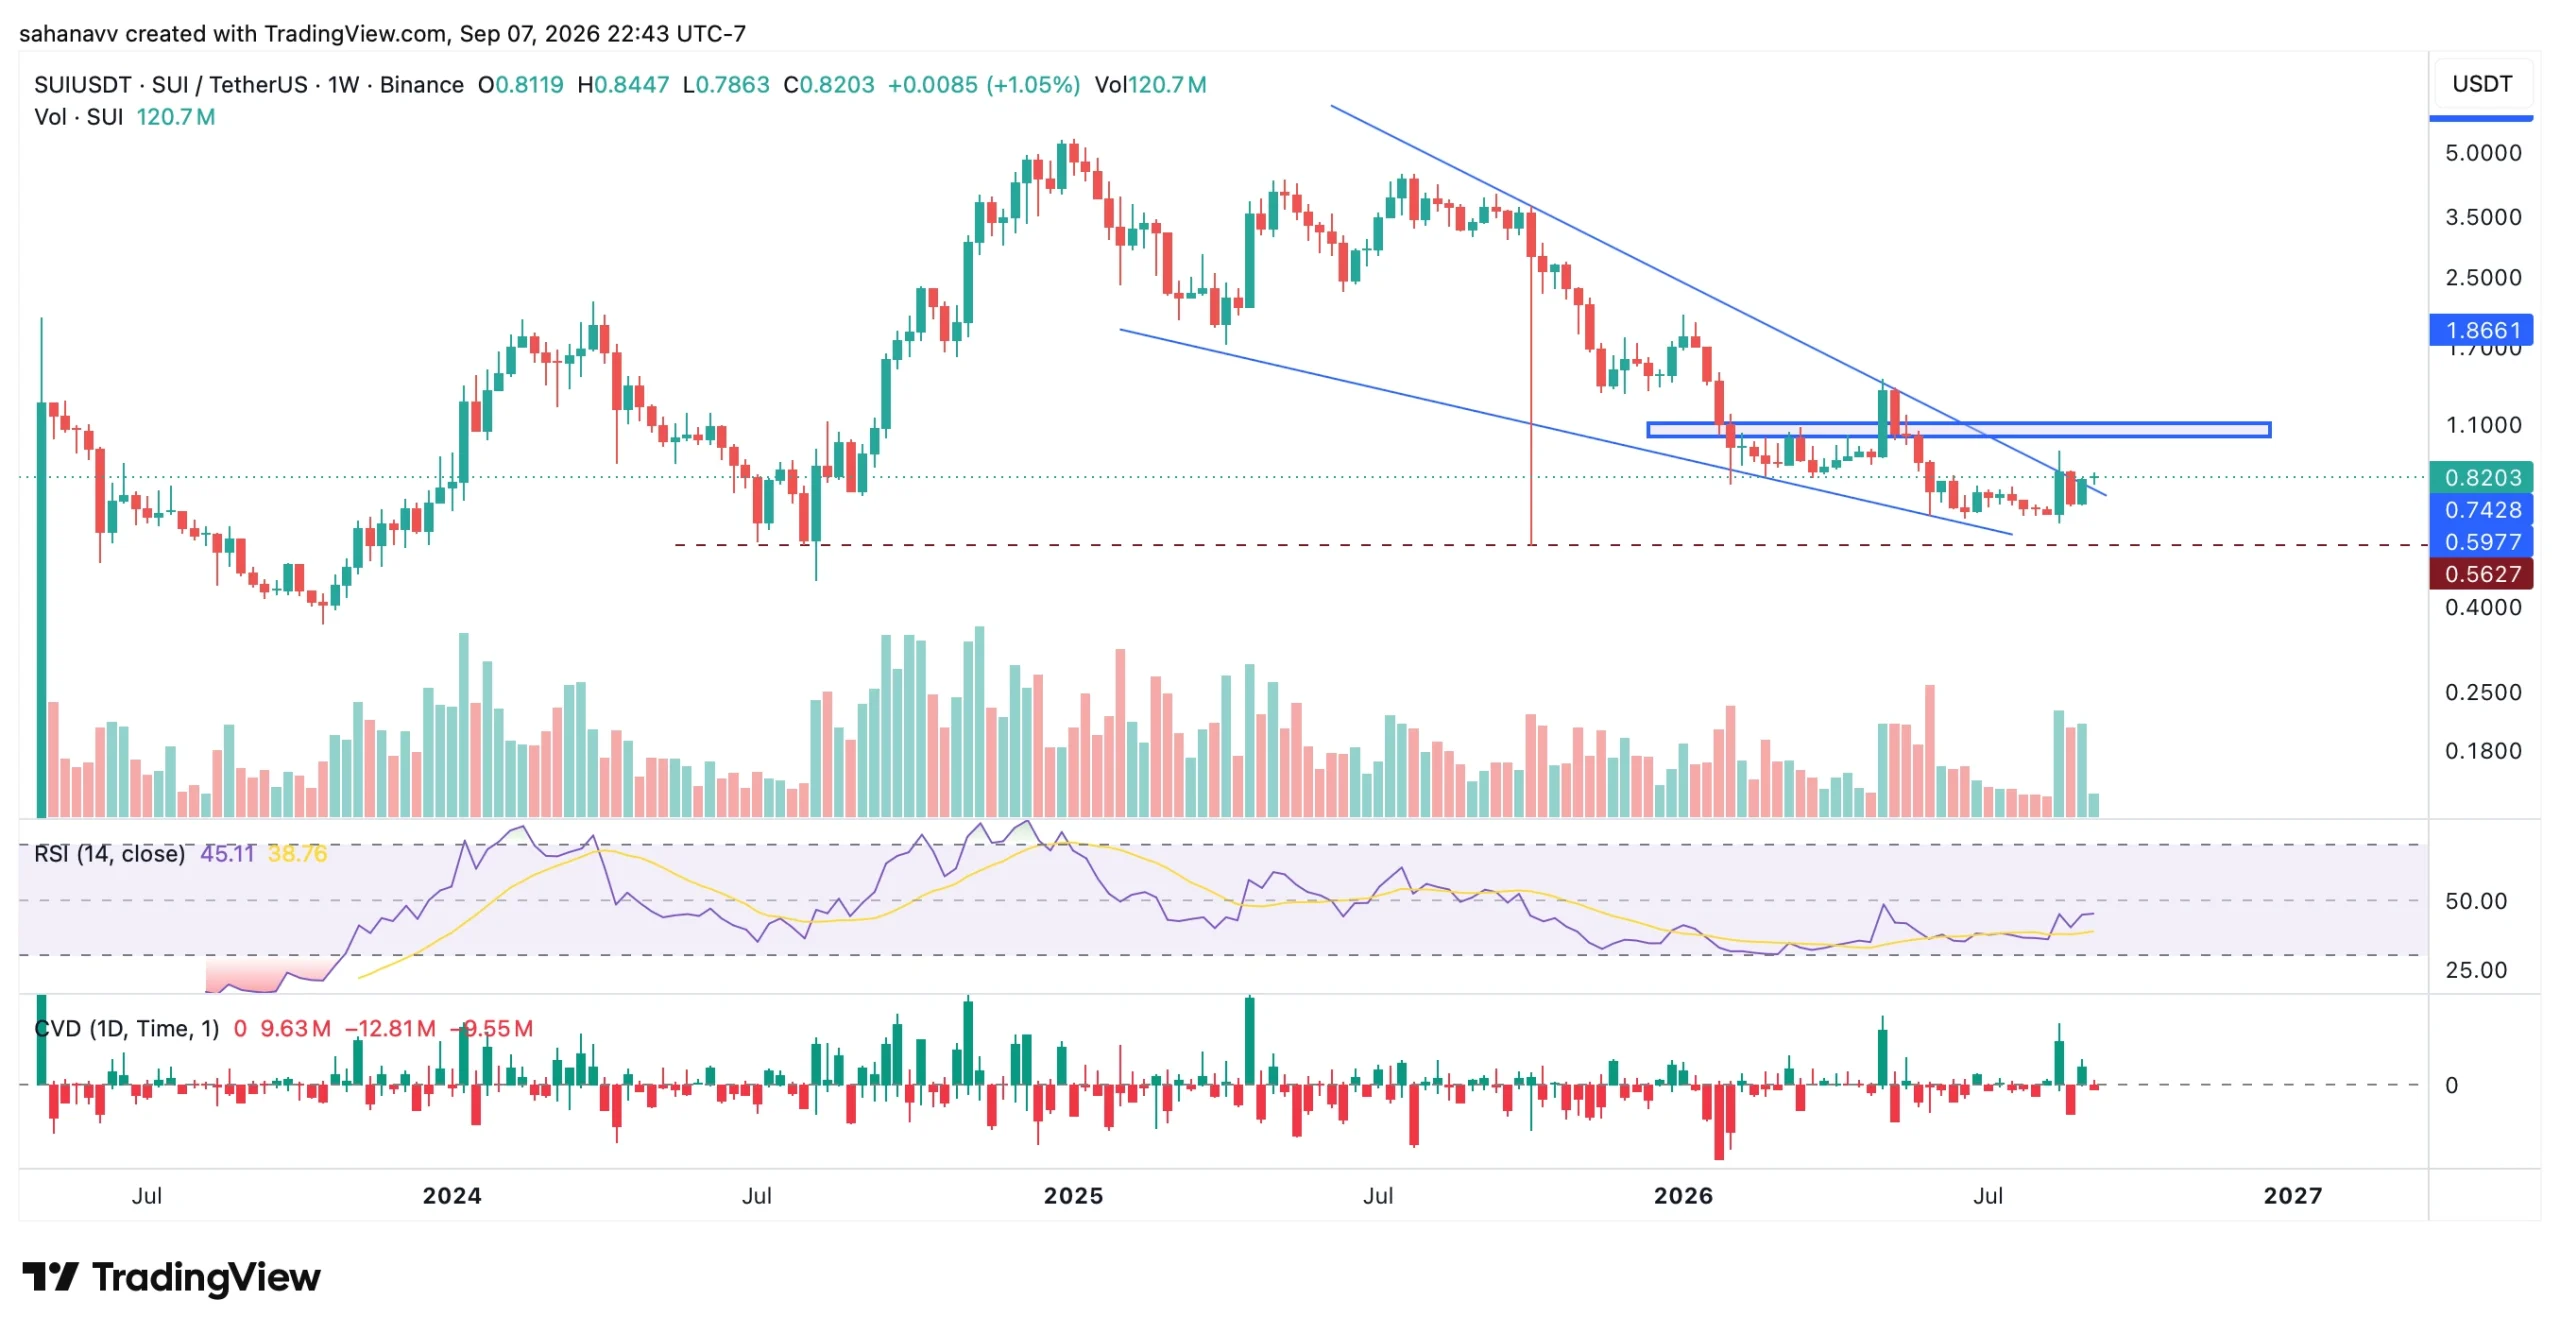
The key test for SUI now sits around $1.10, where a horizontal resistance zone overlaps with the broader descending structure. The token briefly moved above this area earlier in the year before losing momentum, making a decisive weekly close above this range. A breakout backed by strong buying volume could provide confirmation of the beginning of a sustained recovery.

Key Levels to Monitor
- $1.10 – Key Resistance: A decisive weekly close above this level could confirm the breakout and strengthen the bullish setup
- $1.50—First Upside Target: The next major level to watch if SUI clears $1.10
- $1.86—Secondary Target: A move above $1.50 could open the way toward this level
- $2.47—Long-term Target: The chart’s broader pattern projection, representing roughly 200% upside from current levels
- $0.74 to $0.75- Key Support: Holding this zone is important for maintaining the current recovery structure
- $0.56—Major Downside Support: A break below $0.74 to $0.75 could expose SUI to this deeper support area.
SUI Price Prediction September 2026: Can SUI Break $1.10?
SUI is showing signs of a potential trend reversal after months of trading within a descending structure, but the breakout still needs confirmation. The $1.10 resistance remains the key level for bulls. A weekly close above this range could strengthen the bullish case for a move into the $1.50 to $1.80 range. A failure could expose the rally to the $0.74 to $0.75 support zone, while a breakdown below it would weaken the recovery and push the levels close to $0.56.
Was this writing helpful?
Story Ends Here
Read the Next News