



On Wednesday, Bitcoin broke above $65,000 and has since rallied to about $73,856. Key drivers included US Treasury bond buybacks, White House regulatory support, and a massive short squeeze.
However, the persistent question for every investor and onlooker right now is: has Bitcoin entered a bull run or is this just a bull trap?
Bitcoin bull run or bull trap?
Bitcoin structurally mimics the 2022 bear market, even with the FTX crash factored in. This means the coin is likely to follow a similar rally to the one that ensued after that year’s crash.
Additionally, the MVRV (Market Value to Realized Value) Z-score is currently 0.56. This is neutral territory, where prices are based on on-chain cost basis rather than speculative hype.

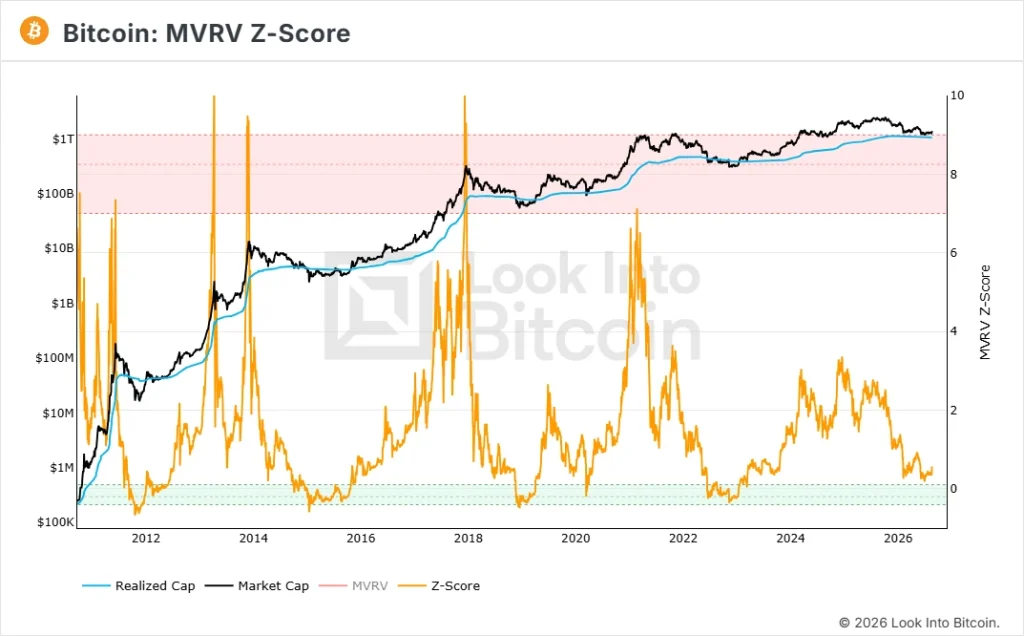
Source: Look Into Bitcoin
Third is the weekly Relative Strength Indicator (RSI), which currently stands at 49.5 – the edge of a major structural shift. Supporting this bullish argument is that BTC initially printed lower lows near $59,000, while RSI printed higher lows.
Fourth is the Realized HODL (RHODL) Ratio, which is increasingly approaching the green band. This is a positive sign since it shows speculative retailers have been flushed out in favor of long-term holders. Historically, this indicator has successfully identified the market bottoms of 2015, 2018, and 2022.
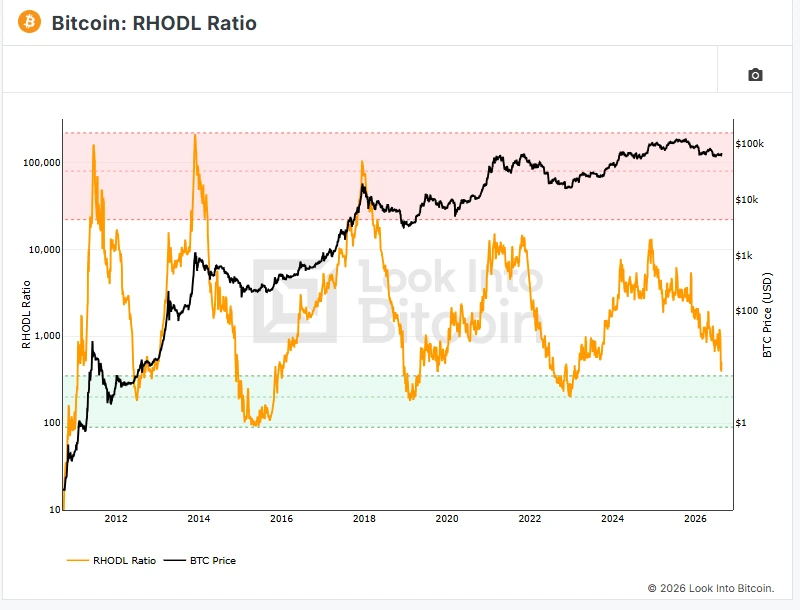
Source: Look Into Bitcoin
Fifth is the positive flip in Bitcoin spot ETF inflows. These products pulled in over $1 billion in net inflows in a three-day streak culminating in $517.2 million net inflows on Wednesday. Meaningful spot demand is strongly indicative of a bullish reversal.
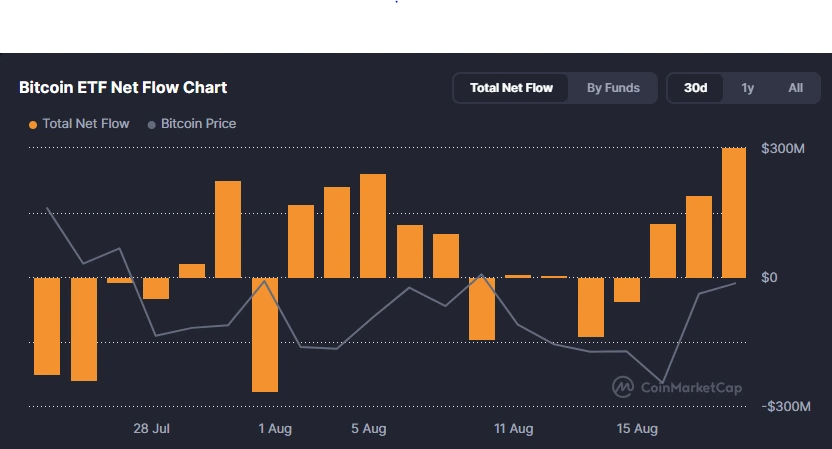
Source: CoinMarketCap
Next is the Satoshimeter, which is currently at a low of 2.57. Previous capitulation stages have hit lows of 1.6, but current momentum indicates a bottoming out.
Finally is the nature of the current rally where data shows it was mostly driven by a short squeeze cascade (over $3B out of $3.5B liquidations were shorts) rather than organic demand. This, however, seems to be changing as spot Cumulative Volume Delta (CVD) has turned positive, indicating whales are buying the breakout.
The verdict
The caveat here is that the spot CVD remains about 40% below its 200-day moving average. A true macro expansion is characterized by several consecutive weeks of rising spot CVD, indicating continuous absorption of sell pressure.
The conclusion is that while most signs point to a bottom, there is a need for sustained spot demand to confirm sound bullish momentum. A weekly close above $68,000, followed by a push to $75,000, could pave the way for $100,000 at year’s end.
Was this writing helpful?
Story Ends Here
Read the Next News