



As crypto markets face some upward pressure, the Ethereum price approaches the $2,300 support range. The daily chart shows weakening momentum, with the technicals supporting the bearish narrative. At the same time, the ETF outflows have also intensified the bearish sentiment, as institutional demand has remained inconsistent. Meanwhile, the derivative data suggests that leveraged positioning has erased, even as long positions continue to pay a funding premium.
The question now arises whether buyers can defend the support at $2300 or whether a sustained breakdown will extend the decline to $2200 or below.
Ethereum Market Overview
| Market Metric | Chart Reading |
| Current trading at | $2,302 |
| Daily Open | $2,321 |
| Daily High | $2,329 |
| Daily Low | $2,299 |
| Daily Change | -0.62% |
| Volume Change | +1.27% |
ETH Open Interest Falls as Derivatives Sentiment Remains Mixed
After breaking the support area around $2,350, the price of ETH is under intense selling pressure and is having difficulty holding $2,320. The second-largest token appears to be pulling back from its September–October highs based on the overall price action. As the sellers maintain the short-term advantage, the latest price action shows downward pressure. However, the strength of the purchasers and their capacity to maintain the support will play a major role in a recovery to $2,300.
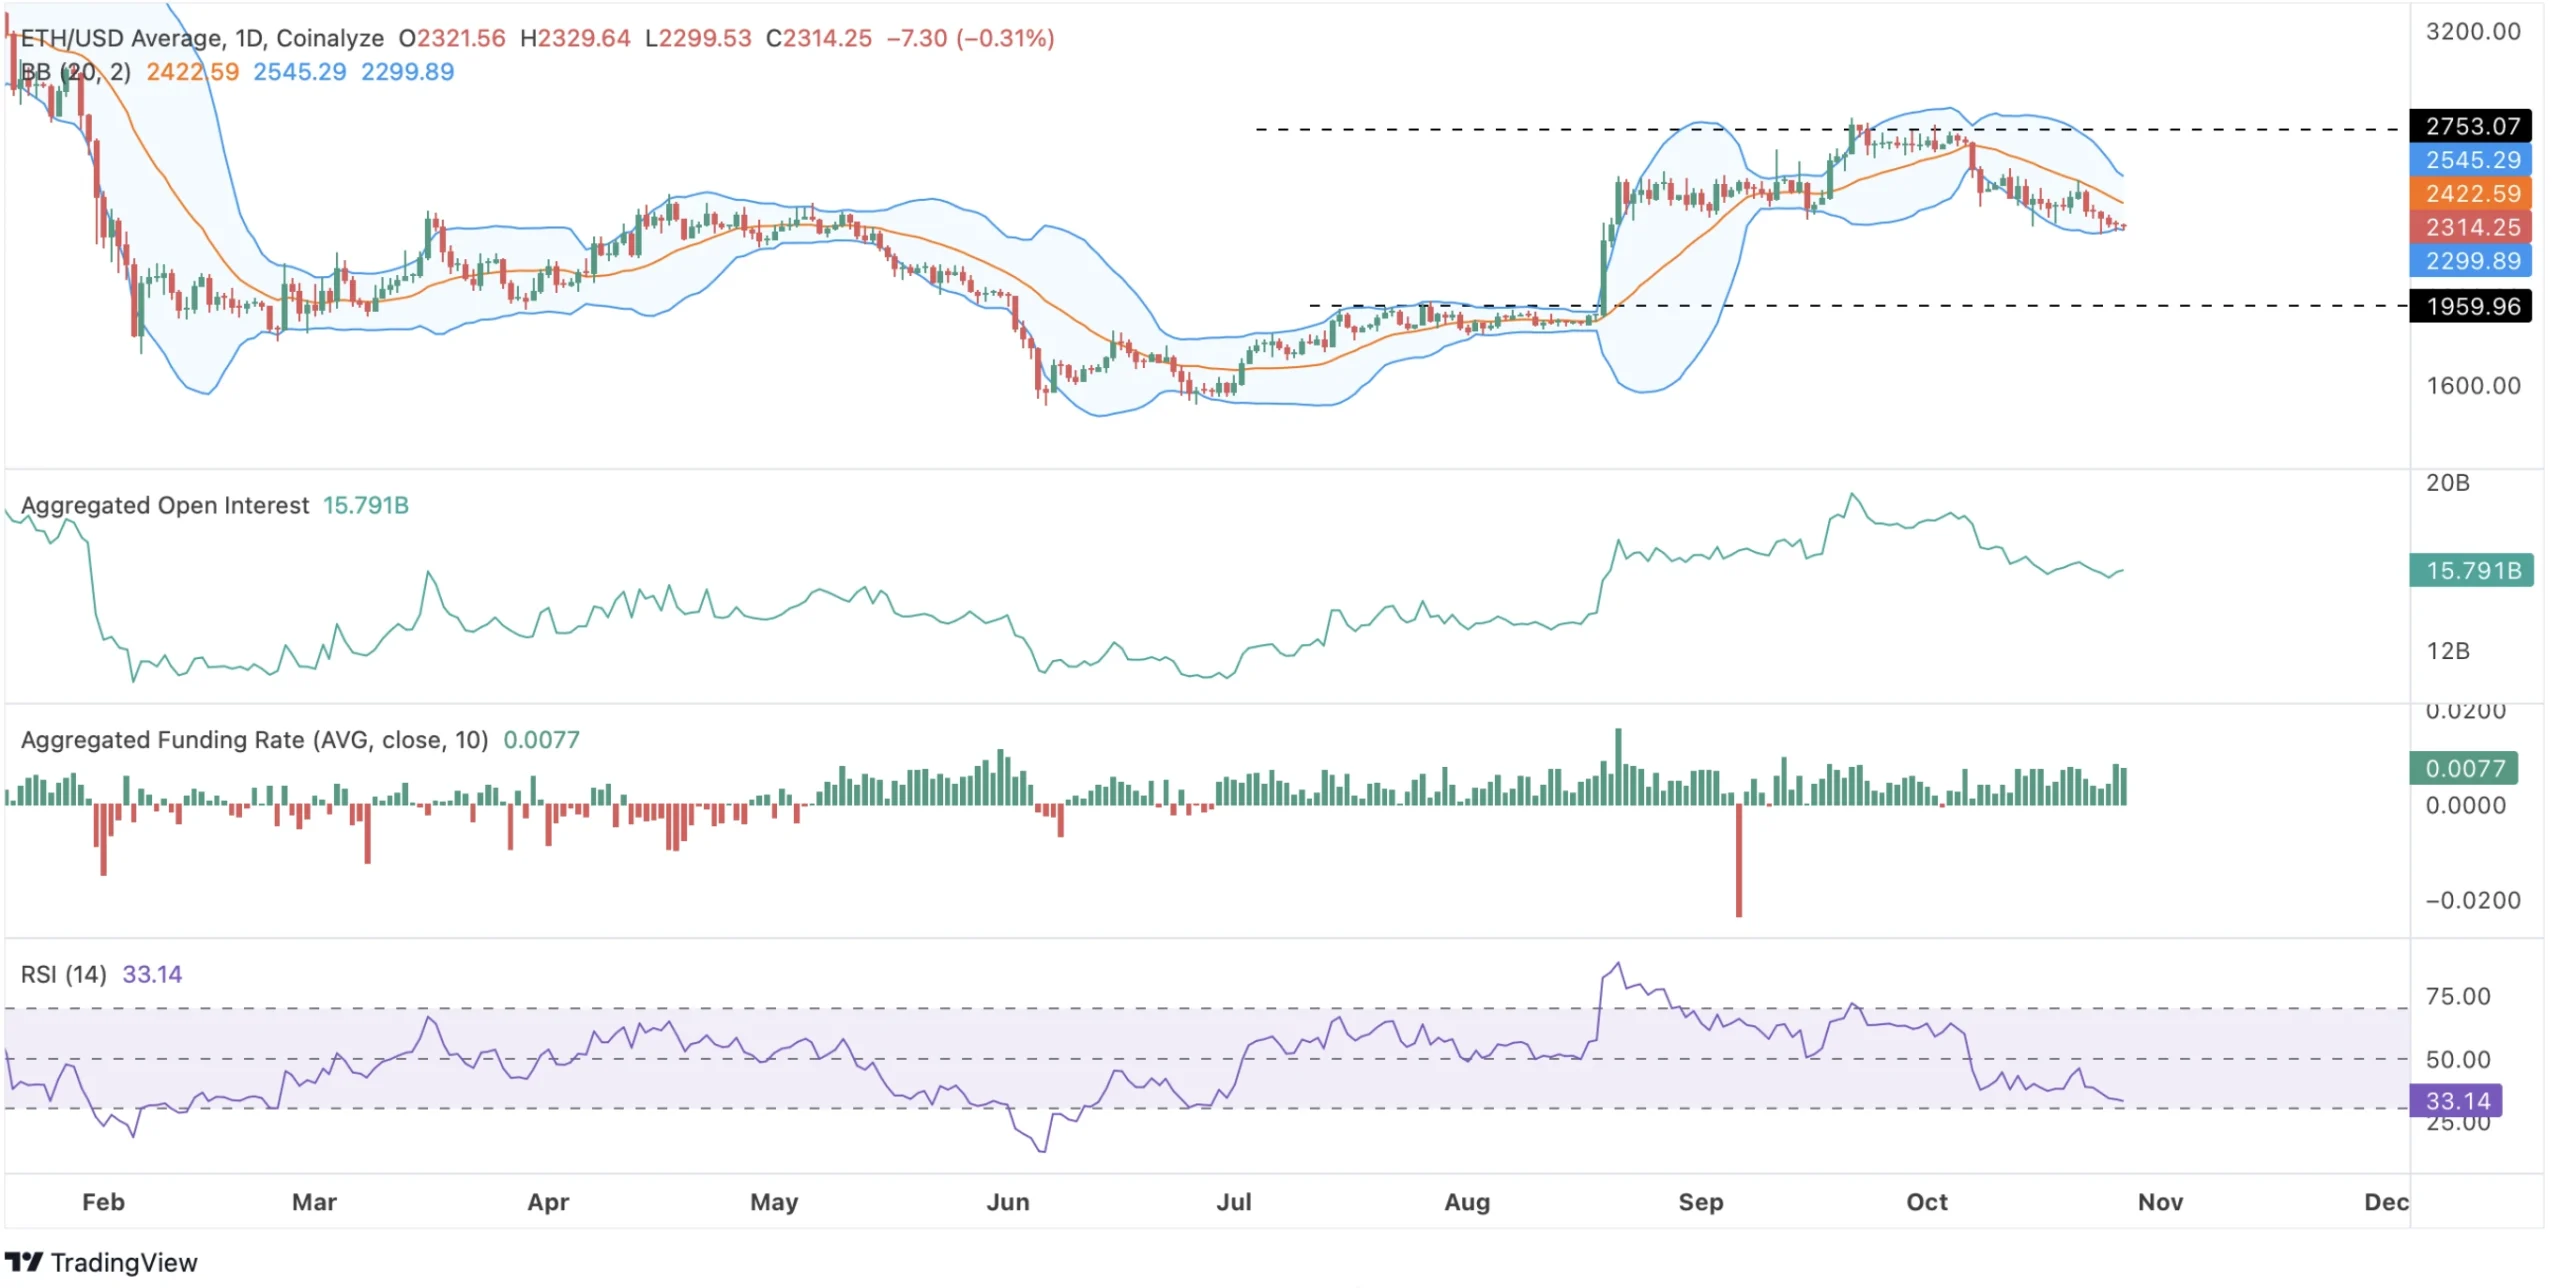
The Bollinger bands have started to contract, as can be seen in the chart above, supporting the bearish assertion. The price is approaching the lower bands, where a rebound is anticipated, and is currently trading below the intermediate bands. However, the bears can push the levels below $2000 if the price doesn’t start to rise again. Conversely, the current price fall has coincided with a decline in the aggregate open interest from its peak.

Additionally, the average funding rate is positive at about 0.0077, meaning that the long positions are covering the short positions. Caution is indicated by a combination of diminishing open interest, positive funding, and weakening price movement.
What’s Next for ETH Price: Bullish & Bearish Scenario
The bullish scenario depends on ETH price holding the $2,300 to $2,315 support region and recovering above the intraday high near $2,330. A stronger recovery above $2,422 would signal improving momentum, especially if accompanied by a rising RSI & strong buying volume. This could encourage buyers to push toward the upper Bollinger bands around $2,550.
Besides, a decisive close below $2,300 and a failure to reclaim this level would trigger the bearish scenario, exposing the rally towards the support around $2,231. Overall, the Ethereum price is approaching a significant decisive point where the momentum is weak. The key level to watch now is around $2,300, as a bullish confirmation could push price higher, while a failure may drag levels lower.
Was this writing helpful?
Story Ends Here
Read the Next News