



SUI price is back above a critical breakout zone, with bulls now eyeing a larger recovery toward $1.50. The token has reclaimed the $1 mark after a sharp September rally, while rising volume confirms stronger market participation. The latest move also comes with a major technical shift on the weekly chart, where the Parabolic SAR has turned bullish for the first time in months. With $1.08–$1.10 acting as the next major hurdle, SUI’s ability to hold the breakout could determine whether the rally extends toward $1.50.
Weekly SAR Flips Bullish as SUI Reclaims Key Structure
SUI’s weekly Parabolic SAR has flipped bullish, strengthening the case for a broader trend reversal. The indicator has shifted below price after an extended bearish phase, while SUI has simultaneously reclaimed the $0.90–$1.00 zone with stronger trading activity. The signal is gaining relevance because it appears alongside a breakout from the descending structure visible on the higher-timeframe chart.
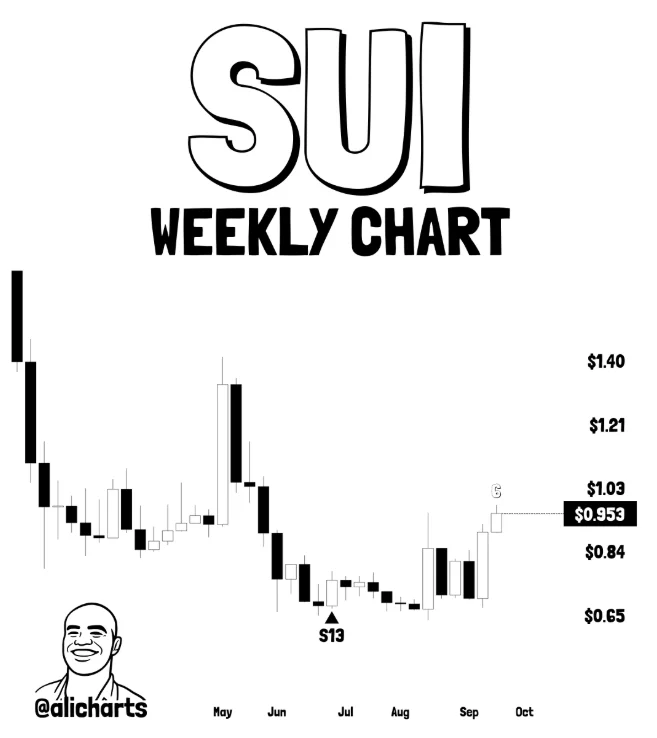
Unlike a short-term daily signal, the weekly SAR reflects a broader trend and can take longer to reverse.A sustained move above $1.08–$1.10 would provide stronger confirmation and expose $1.20, followed by the larger $1.40–$1.50 resistance zone. However, a drop below $0.90 would weaken the breakout structure and put the bullish reversal under pressure.
SUI Momentum Gets a Fundamental Boost
The technical reversal comes alongside fresh infrastructure developments on the Sui network. This week, Sui introduced real-time GraphQL subscriptions, allowing developers to receive checkpoints, transactions and events as they happen through the same GraphQL interface. The system can also backfill data from a previous cursor after a connection is interrupted.

The upgrade is relevant for applications that require continuous blockchain data, including wallets, trading platforms, analytics products, monitoring systems and AI applications. SUI’s recent rally has also coincided with broader rotation into Layer-1 tokens. Derivatives activity increased sharply during the move, with open interest reportedly rising to around $402 million, adding leverage to the price breakout.
SUI Price Analysis: Can SUI Reach $1.50?
SUI is trading around $0.95 after falling from the recent $1.02 intraday high. Recent price action shows a decisive move through the $0.90–$0.95 resistance band, followed by rejection near $1.05–$1.08. The first hurdle is $1.00, followed by $1.05–$1.10. A daily and then weekly close above $1.10 would strengthen the breakout structure and put $1.20 in focus before the larger $1.40–$1.50 resistance region.
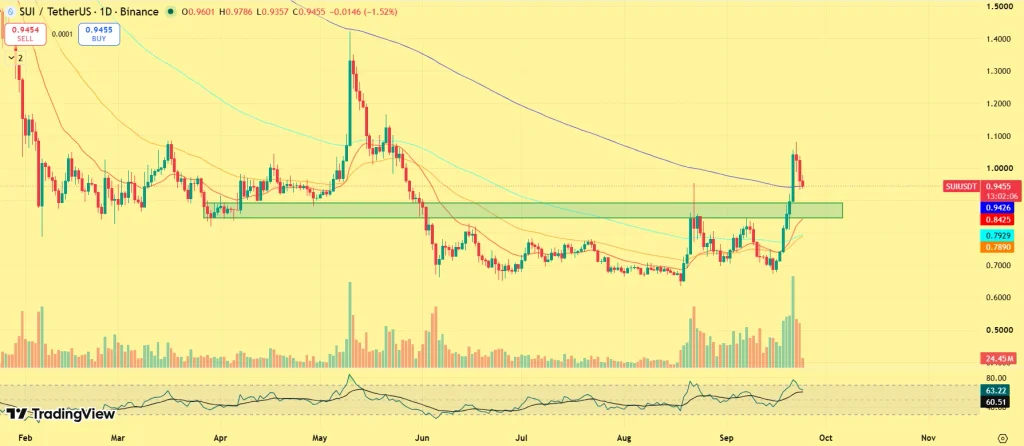
On the downside, $0.90–$0.95 is now the critical area. Holding this zone would preserve the breakout; a sustained move below $0.90 would weaken the setup and bring the lower $0.80–$0.85 region back into focus.
Final Take
SUI’s price has moved from range-bound recovery to a potential trend reversal, with the weekly SAR flip adding confirmation to the recent price breakout. The network’s latest GraphQL upgrade strengthens the ecosystem narrative, while elevated derivatives activity has amplified the move. The $1.10 level remains the decisive technical hurdle; clearing it would put the broader $1.50 resistance zone firmly on the radar.
Was this writing helpful?
Story Ends Here
Read the Next News